JUNE 2024
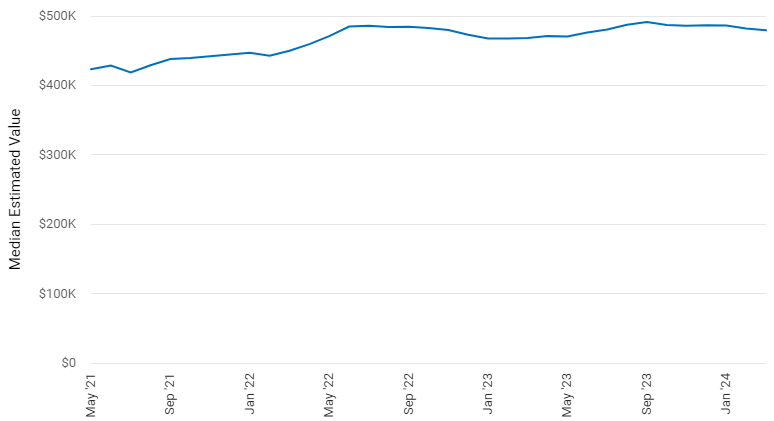
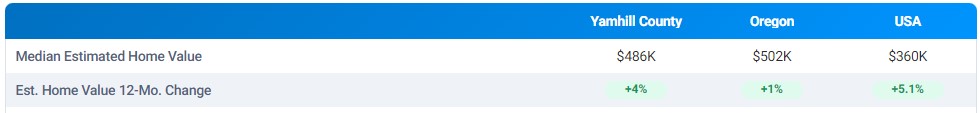
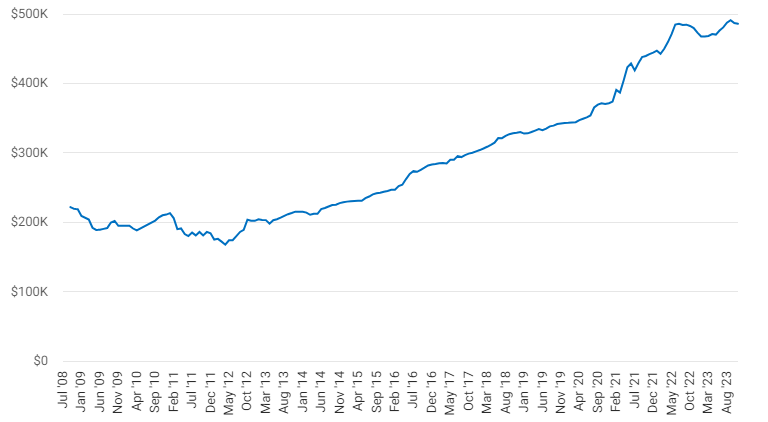
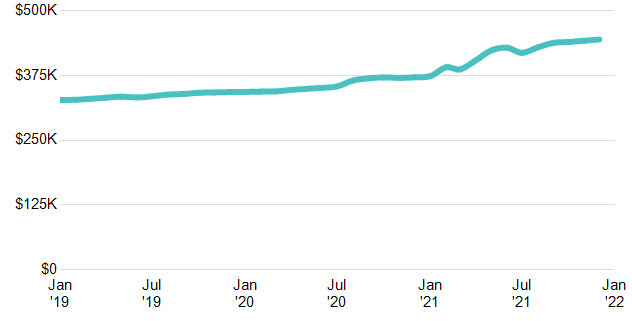
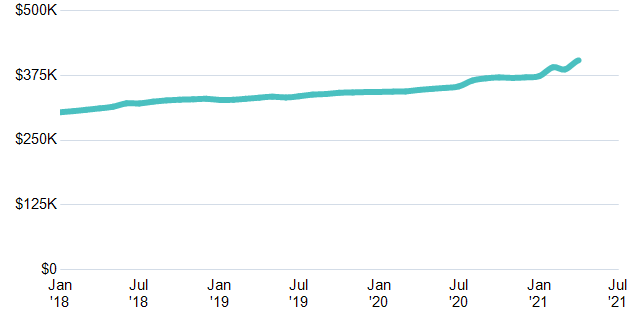
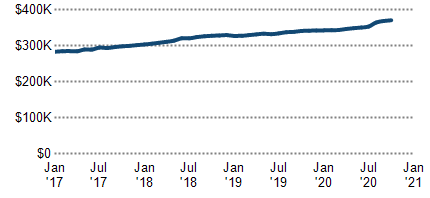
Median Estimated Home Value:$486,750 Updated: 06/30/2024
Change over last month: + .9% Change over last 12 months: +2.2%

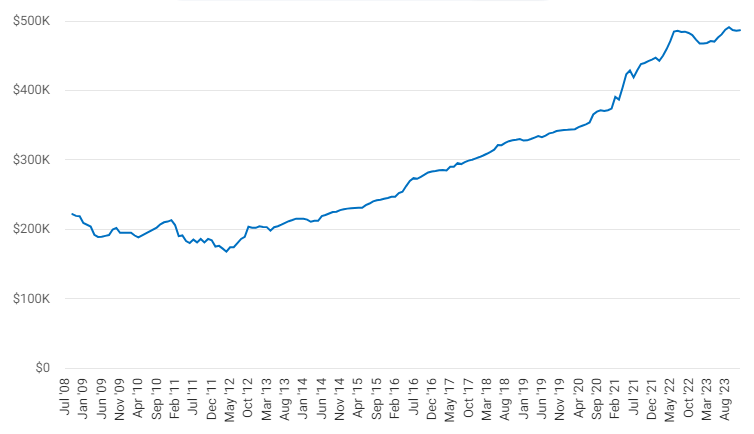
MEDIAN ESTIMATED PROPERTY VALUE

Housing Facts and Stats

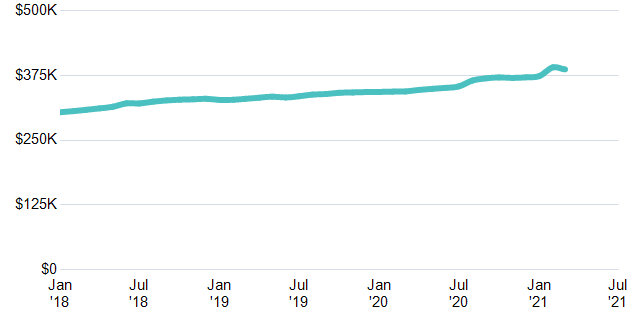
ARCHIVED: May 2024
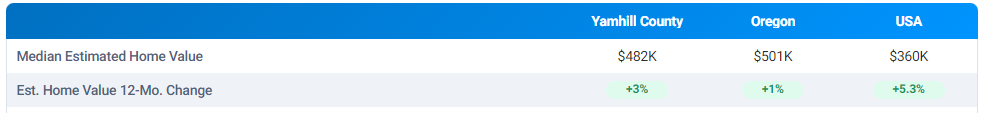
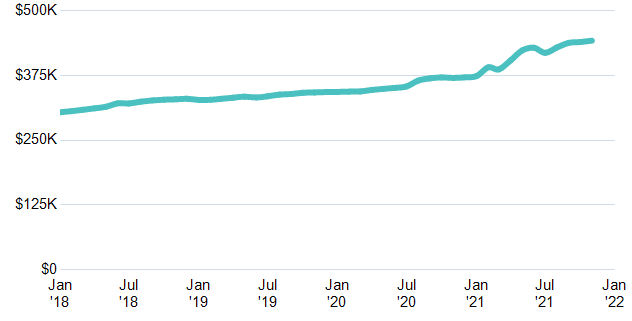
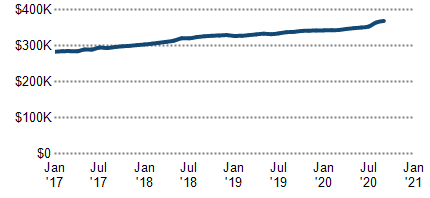
Median Estimated Home Value:$482,580 Updated: 05/31/2024
Change over last month: + .8% Change over last 12 months: +2.6%

MEDIAN ESTIMATED PROPERTY VALUE

Housing Facts and Stats

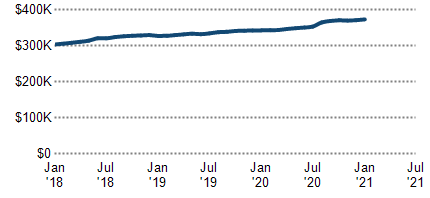
Archived: April 2024
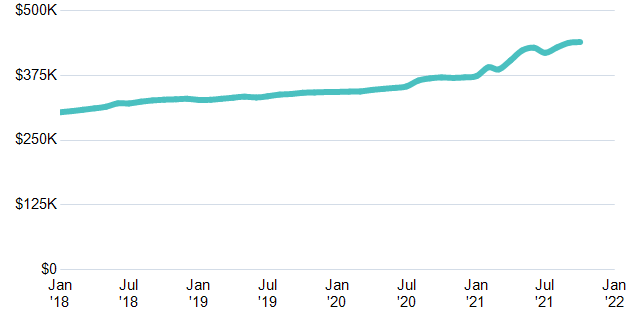
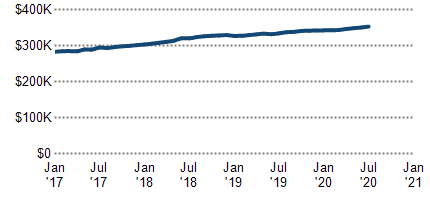
Median Estimated Home Value:$478,630 Updated: 04/30/2024
Change over last month: – .1% Change over last 12 months: +1.6%

MEDIAN ESTIMATED PROPERTY VALUE

Housing Facts and Stats

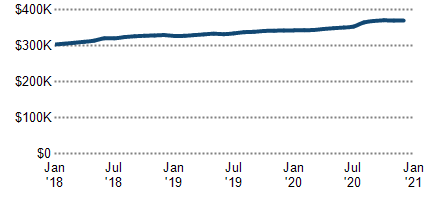
ARCHIVED: March 2024
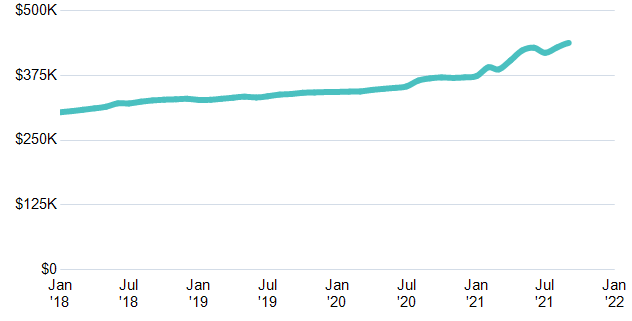
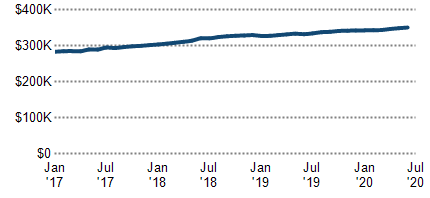
Median Estimated Home Value:$479,310 Updated: 03/31/2024
Change over last month: – .5% Change over last 12 months: +2.3%

MEDIAN ESTIMATED PROPERTY VALUE
Housing Facts and Stats
Archived: February 2024
Median Estimated Home Value:$481,290 Updated: 02/29/2024
Change over last month: – .9% Change over last 12 months: +3.0%

MEDIAN ESTIMATED PROPERTY VALUE
HOUSING FACTS and STATS
ARCHIVED:January 2024
Median Estimated Home Value:$486,170 Updated: 01/31/2024
Change over last month: – .1% Change over last 12 months: +4.0%

MEDIAN ESTIMATED PROPERTY VALUE

HOUSING FACTS and STATS
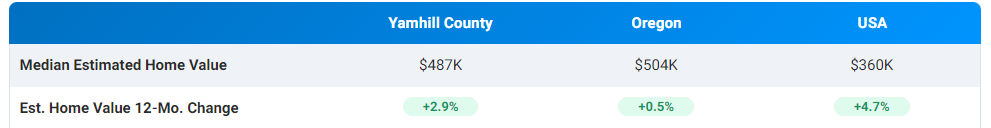
ARCHIVED: December 2023
Median Estimated Home Value:$486,670 Updated: 12/31/2023
Change over last month: +.02% Change over last 12 months: +2.9%

MEDIAN ESTIMATED PROPERTY VALUE
HOUSING FACTS and STATS
ARCHIVED: November 2023
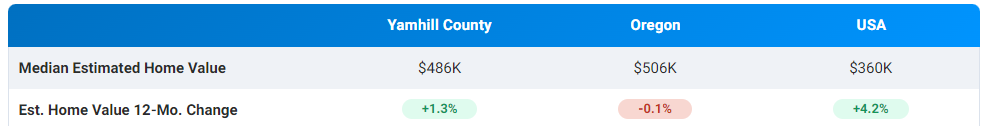
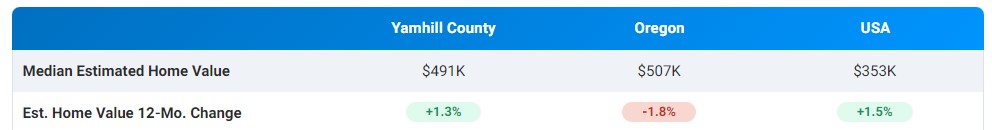
Median Estimated Home Value:$485,870 Updated: 11/30/2023
Change over last month: – .02% Change over last 12 months: +1.3%

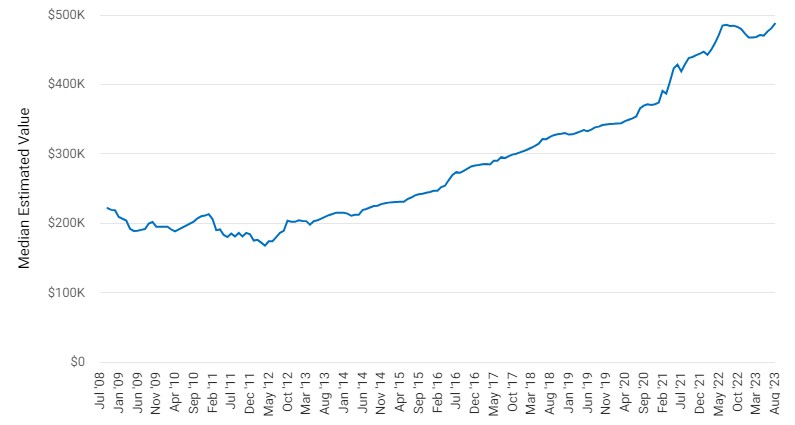
MEDIAN ESTIMATE PROPERTY VALUE
HOUSING FACTS and STATS
ARCHIVED: October 2023
Median Estimated Home Value:$486,990 Updated: 10/31/2023
Change over last month: – .09% Change over last 12 months: + .09%

MEDIAN ESTIMATE PROPERTY VALUE
HOUSING FACTS and STATS
ARCHIVED: September 2023
Median Estimated Home Value:$491,970 Updated: 09/30/2023
Change over last month: +.8% Change over last 12 months: 1.3%

MEDIAN ESTIMATE PROPERTY VALUE

HOUSING FACTS and STATS
Archived: August 2023
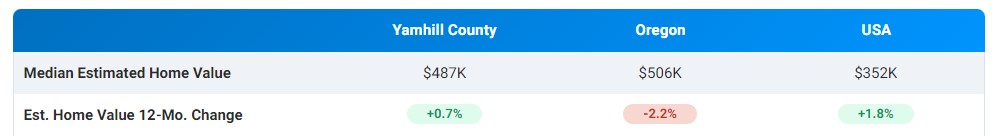
Median Estimated Home Value:$487,440 Updated: 08/31/2023
Change over last month: +1.4% Change over last 12 months: 0.7%

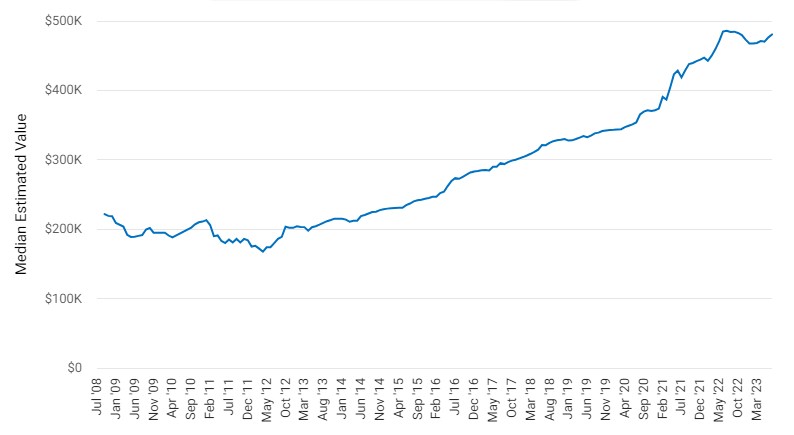
MEDIAN ESTIMATE PROPERTY VALUE
HOUSING FACTS and STATS
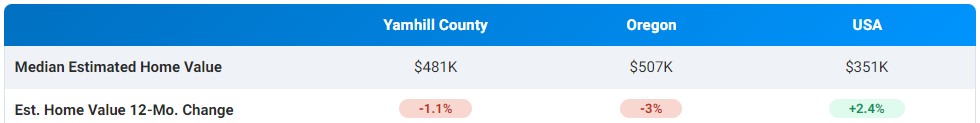
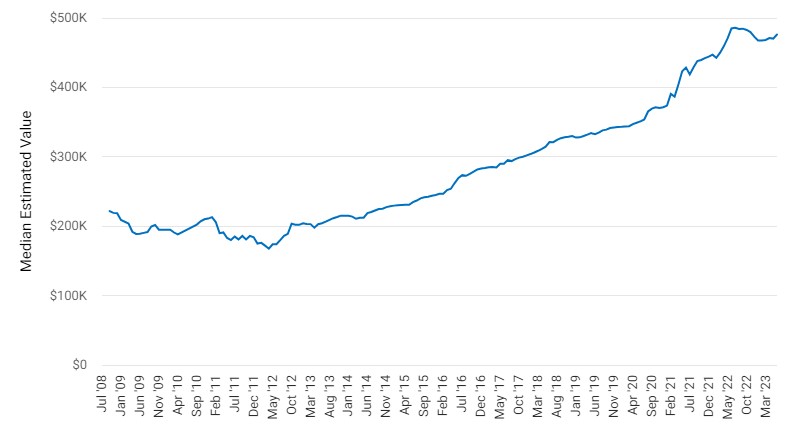
Archived: July 2023
Median Estimated Home Value:$480,660 Updated: 07/31/2023
Change over last month: +0.9% Change over last 12 months: -1.1%

MEDIAN ESTIMATE PROPERTY VALUE
HOUSING FACTS and STATS
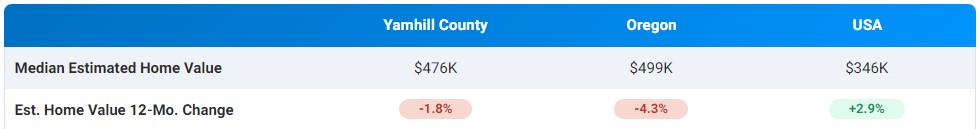
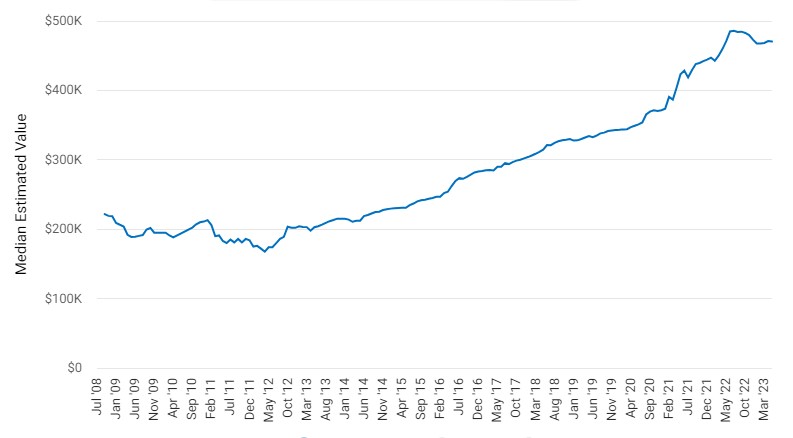
Archived: June 2023
Median Estimated Home Value:$464,150 Updated: 06/30/2023
Change over last month: +1.2% Change over last 12 months: -1.8%

Median Estimated Property Value
HOUSING FACTS and STATS
Archived: May 2023
Median Estimated Home Value:$470,330 Updated: 05/31/2023
Change over last month: -0.1% Change over last 12 months: -.01%

Median Estimated Property Value
Housing Facts and Stats
Archived: April 2023
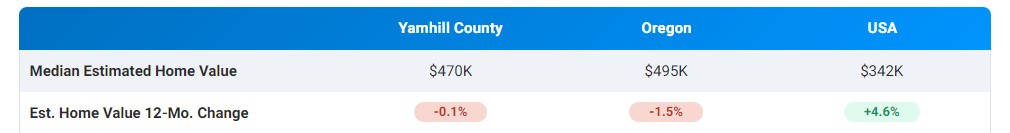
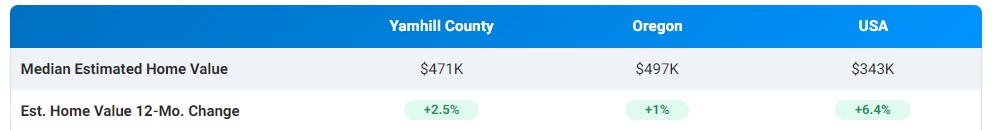
Median Estimated Home Value:$471,000 Updated: 04/30/2023
Change over last month: +0.6% Change over last 12 months:+2.5%

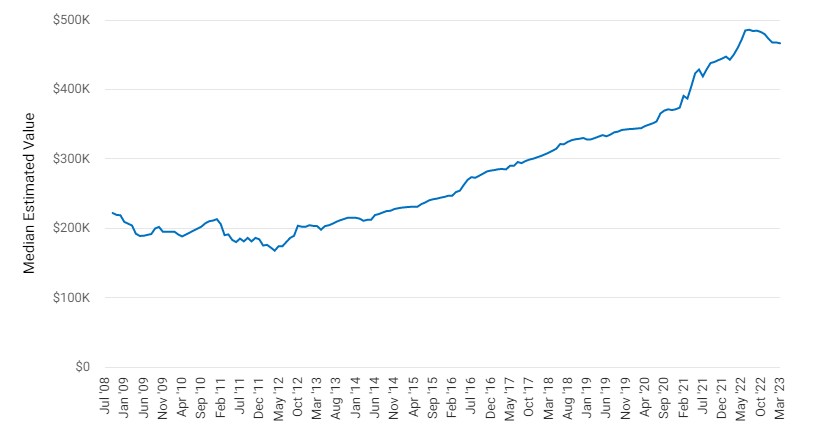
Median Estimated Property Value
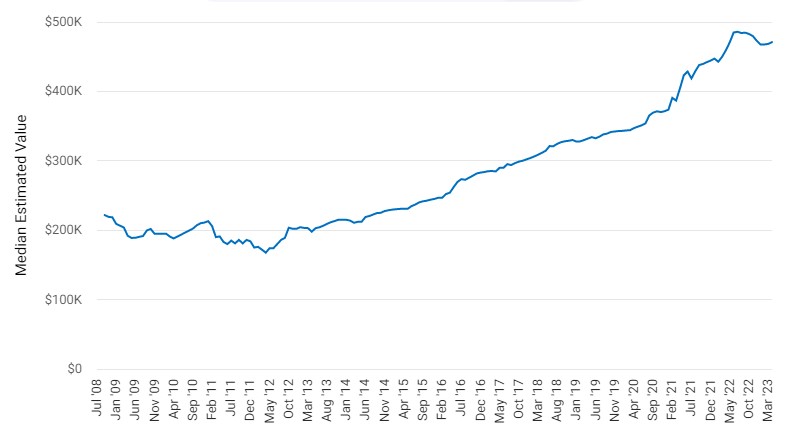
Housing Facts and Stats
ARCHIVED: March 2023
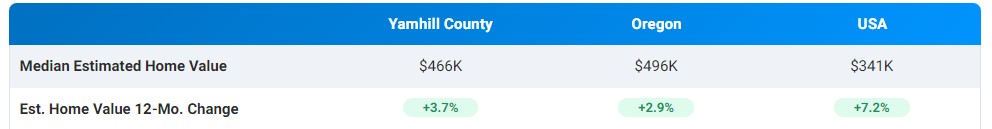
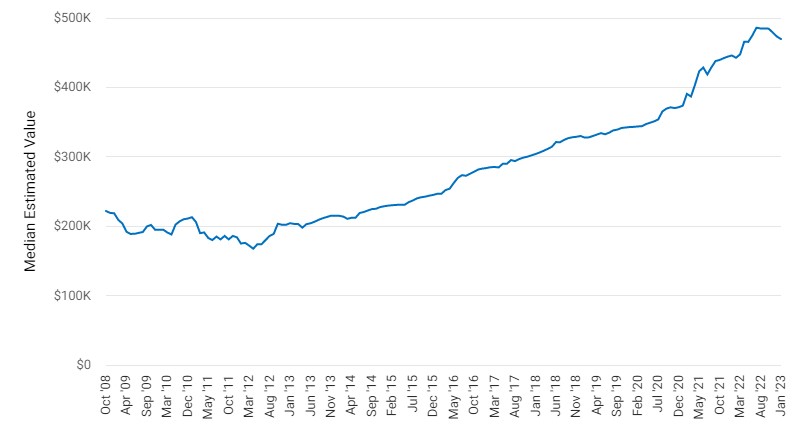
Median Estimated Home Value:$466,460 — Updated: 03/31/2023 Change over last month: -.3% — Change over last 12 months:+3.7%

Median Estimated Property Value
Housing Facts and Stats
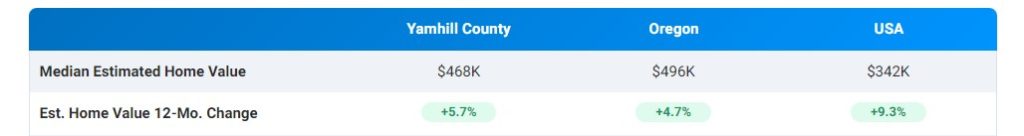
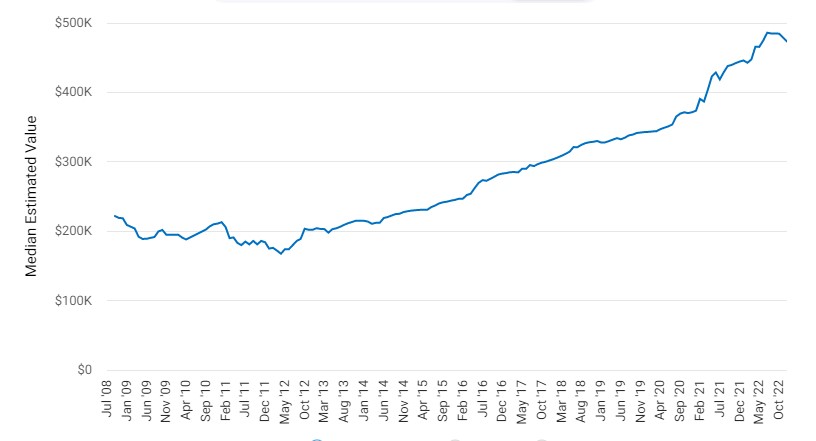
ARCHIVED: February 2023
Median Estimated Home Value:$467,720 — Updated: 02/28/2023 Change over last month: -.4% — Change over last 12 months:+5.7%

Median Estimated Property Value

Housing Facts and Stats
January 2023
Median Estimated Home Value:$469,670 — Updated: 01/31/2023 Change over last month: -.8% — Change over last 12 months:+5.3%

Median Estimated Property Value
Housing Facts and Stats

December 2022
Median Estimated Home Value:$473,280 — Updated: 12/31/2022 Change over last month: -1.2% — Change over last 12 months:+6.5%

Median Estimated Property Value
Housing Facts and Stats
November 2022
Median Estimated Home Value:$478,990 — Updated: 11/30/2022 Change over last month: -1.2% — Change over last 12 months:+8.3%

Median Estimated Property Value
Housing Facts and Stats
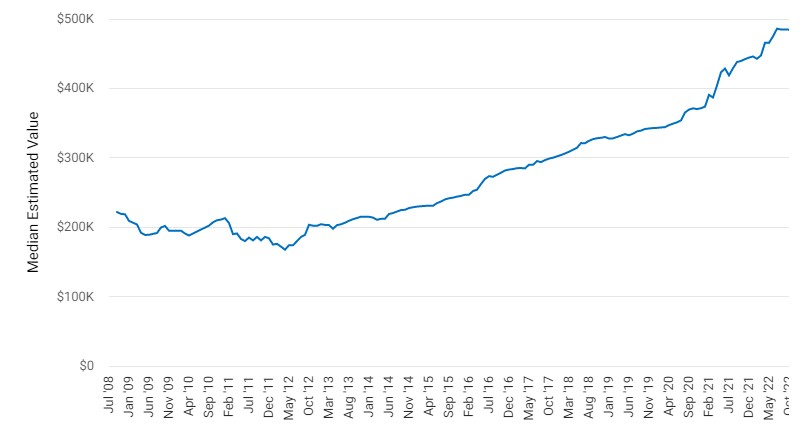
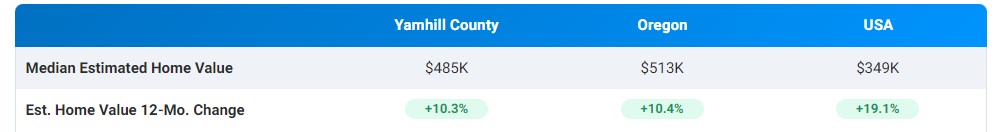
October 2022
Median Estimated Home Value:$484,600 — Updated: 10/31/2022 Change over last month: -.01% — Change over last 12 months:+10.3%
Median Estimated Property Value
Housing Facts and Stats
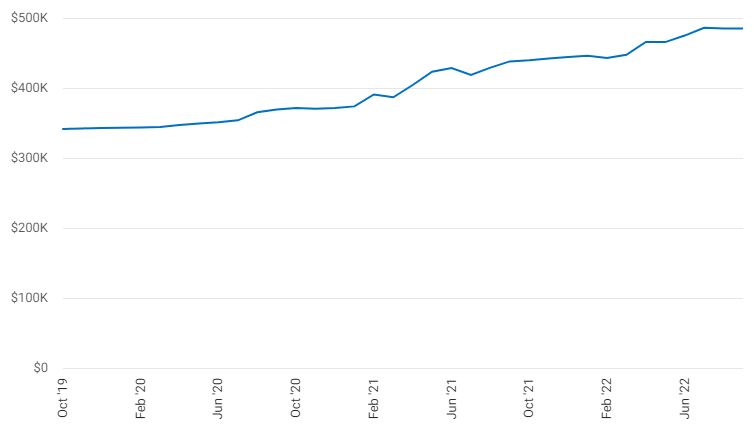
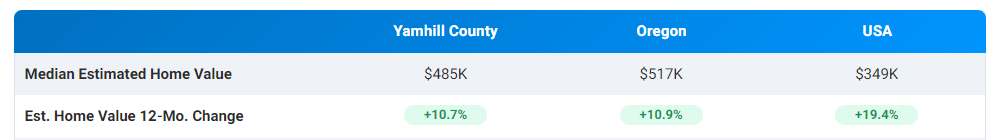
September 2022
Median Estimated Home Value:$485,000 — Updated: 09/30/2022 Change over last month: 0% — Change over last 12 months:+10.7%

Median Estimated Property Value
Housing Facts and Stats
ARCHIVED: August 2022
Median Estimated Home Value:$484,890 — Updated: 08/31/2022 Change over last month: -.2% — Change over last 12 months:+13.0%

Median Estimated Property Value
Housing Facts and Stats
ARCHIVED: July 2022
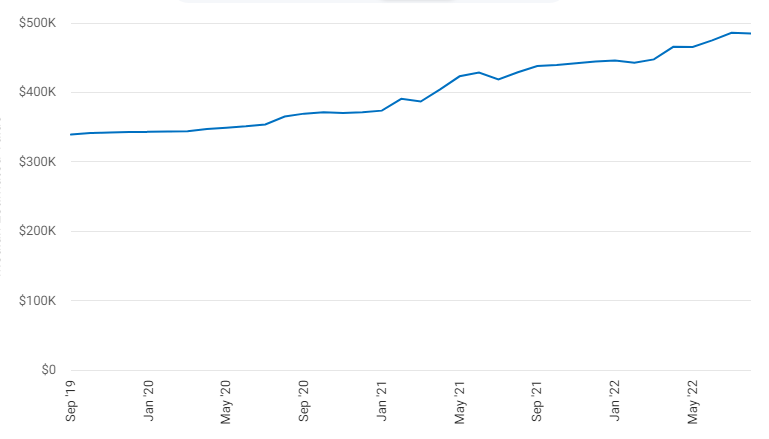
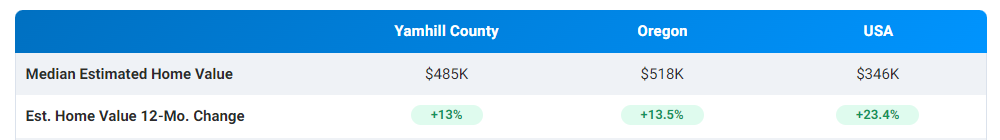
Median Estimated Home Value:$486,010 — Updated: 07/31/2022 Change over last month: +2.3% — Change over last 12 months:+16.1%
Median Estimated Property Value
Housing Facts and Stats
Archived: June 2022JUNE 2022
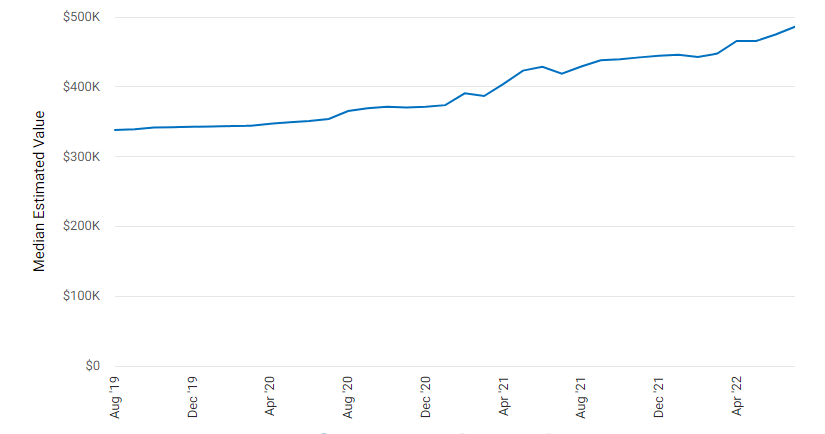
Median Estimated Home Value:$474,900 — Updated: 06/30/2022 Change over last month: +2.0% — Change over last 12 months:+10.8%
Archived: May 2022
Median Estimated Home Value:$465,590 — Updated: 05/31/2022 Change over last month: -.02% — Change over last 12 months:+10.02%
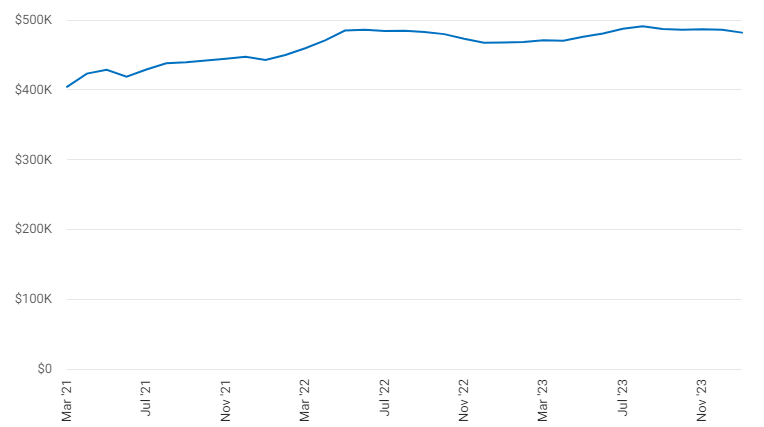
Median Estimated Home Value
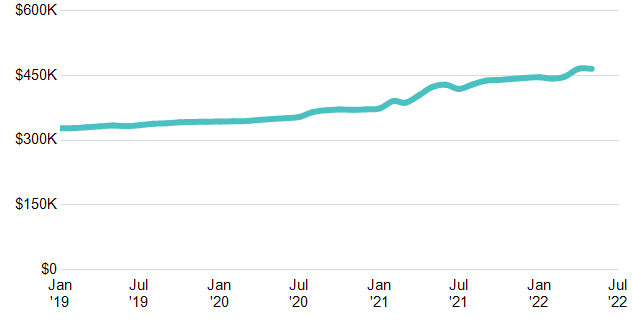
Housing Facts and Stats
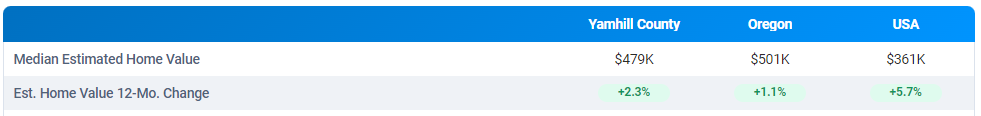
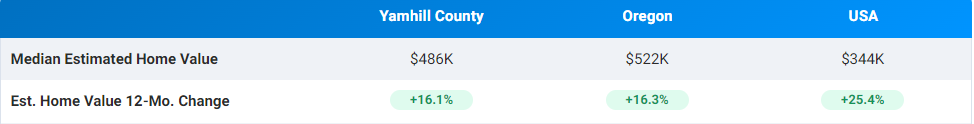
| Yamhill County | Oregon | USA | |
|---|---|---|---|
| Median Estimated Home Value | $466K | $498K | $328K |
| Est. Home Value 12-Mo. Change | +10% | +9.9% | +25.2% |
Price Range of Homes Sold
Last Rolling 6 Months – December 2021-May 2022

Price per Square Foot of Homes Sold
Last Rolling 6 Months – December 2021-May 2022

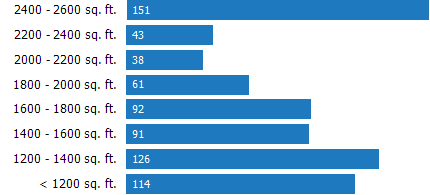
Size of Homes Sold
Last Rolling 6 Months – December 2021-May 2022
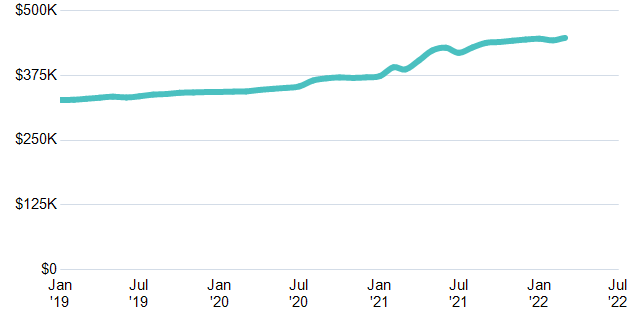
ARCHIVED: April 2022
Yamhill County, Oregon
Median Estimated Home Value:$465,690 —– Updated: 04/30/2022 —–
Change over last month: +4.05% —– Change over last 12 months:+15.19%
Median Estimated Home Value

Housing Facts and Stats
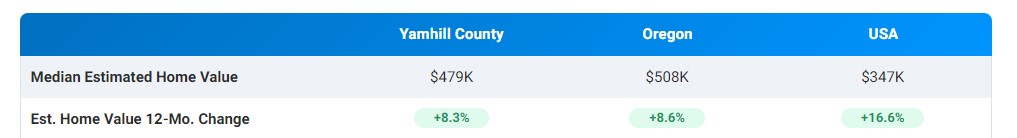
| Yamhill County | Oregon | USA | |
|---|---|---|---|
| Median Estimated Home Value | $466K | $501K | $326K |
| Est. Home Value 12-Mo. Change | +15.2% | +15.6% | +27.7% |
Price Range of Homes Sold
Last Rolling 6 Months – November 2021- April 2022

Price per Square Foot of Homes Sold
Last Rolling 6 Months – November 2021- April 2022

Size of Homes Sold
Last Rolling 6 Months – November 2021- April 2022

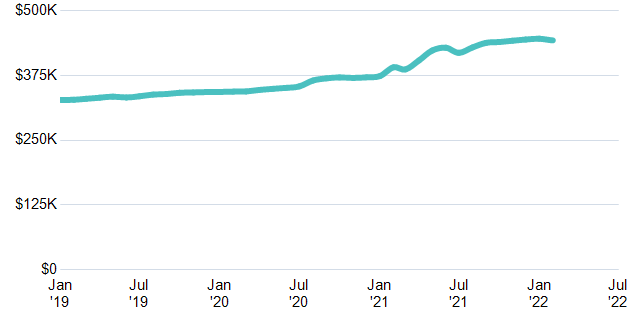
ARCHIVED: March 2022
Yamhill County, Oregon
Median Estimated Home Value:$447,550 —– Updated: 03/31/2022 —– Change over last month: +1.1% —– Change over last 12 months:+15.71%
Median Estimated Home Value
Housing Facts and Stats
| Yamhill County | Oregon | USA | |
|---|---|---|---|
| Median Estimated Home Value | $448K | $478K | $317K |
| Est. Home Value 12-Mo. Change | +15.7% | +16.2% | +22.2% |
Price Range of Homes Sold
Last Rolling 6 Months – October 2021- March 2022

Price per Square Foot of Homes Sold
Last Rolling 6 Months – October 2021- March 2022

Size of Homes Sold
Last Rolling 6 Months – October 2021- March 2022

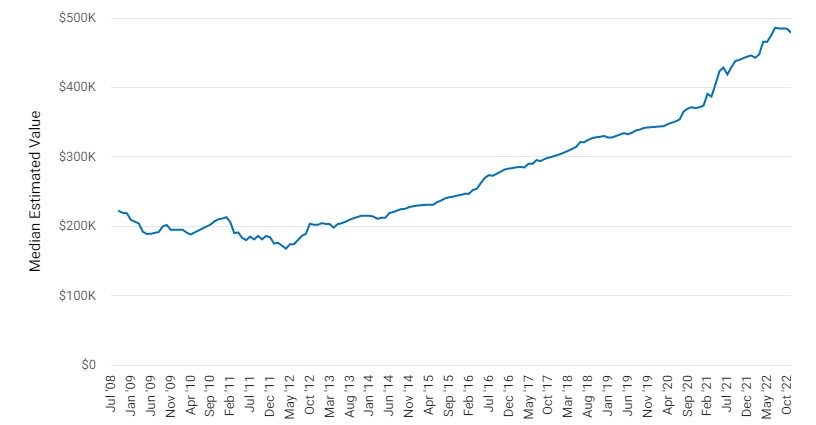
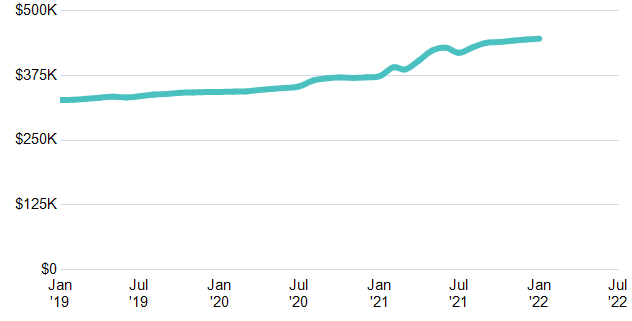
Archived: February 2022
Yamhill County, Oregon
Median Estimated Home Value:$442,700 —– Updated: 02/28/2022 —– Change over last month: -0.74% —– Change over last 12 months:+13.31%
Median Estimated Home Value
Housing Facts and Stats
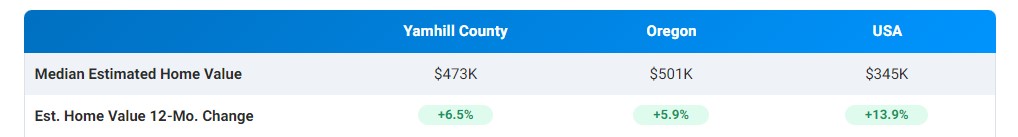
| Yamhill County | Oregon | USA | |
|---|---|---|---|
| Median Estimated Home Value | $443K | $474K | $313K |
| Est. Home Value 12-Mo. Change | +13.3% | +13.9% | +20.9% |
Price Range of Homes Sold
Last Rolling 6 Months – September 2021- February 2022

Price per Square Foot of Homes Sold
Last Rolling 6 Months – September 2021- February 2022

Size of Homes Sold
Last Rolling 6 Months – September 2021- February 2022

Archived: January 2022
Yamhill County, Oregon
Median Estimated Home Value:$445,990 —– Updated: 01/31/2022 —– Change over last month: .36% —– Change over last 12 months:+19.33%
Median Estimated Home Value
v
Housing Facts and Stats
| Yamhill County | Oregon | USA | |
|---|---|---|---|
| Median Estimated Home Value | $446K | $472K | $307K |
| Est. Home Value 12-Mo. Change | +19.3% | +19.1% | +20.7% |
Price Range of Homes Sold
Last Rolling 6 Months – August 2021- January 2022

Price per Square Foot of Homes Sold
Last Rolling 6 Months – August 2021- January 2022

Size of Homes Sold
Last Rolling 6 Months – August 2021- January 2022

Archived: December 2021
Yamhill County, Oregon
Median Estimated Home Value:$444,380 —– Updated: 12/31/2021 —– Change over last month: .5% —– Change over last 12 months:+19.64%
Median Estimated Home Value
Housing Facts and Stats
| Yamhill County | Oregon | USA | |
|---|---|---|---|
| Median Estimated Home Value | $444K | $473K | $303K |
| Est. Home Value 12-Mo. Change | +19.6% | +20.2% | +19.6% |
Price Range of Homes Sold
Last Rolling 6 Months – July 2021- December 2021

Price per Square Foot of Homes Sold
Last Rolling 6 Months – July 2021- December 2021

Size of Homes Sold
Last Rolling 6 Months – July 2021- December 2021

Archived: November 2021
Yamhill County, Oregon
Median Estimated Home Value:$442,150 —– Updated: 11/30/2021 —– Change over last month: .59% —– Change over last 12 months:+19.43%
Median Estimated Home Value
Housing Facts and Stats
| Yamhill County | Oregon | USA | |
|---|---|---|---|
| Median Estimated Home Value | $442K | $468K | $298K |
| Est. Home Value 12-Mo. Change | +19.4% | +20.3% | +16.5% |
Price Range of Homes Sold
Last Rolling 6 Months – June 2021- November 2021

Price per Square Foot of Homes Sold
Last Rolling 6 Months – June 2021- November 2021

Size of Homes Sold
Last Rolling 6 Months – June 2021- November 2021

Archived: October 2021
Yamhill County, Oregon
Median Estimated Home Value:$439,540 —– Updated: 10/31/2021 —– Change over last month: .36% —– Change over last 12 months:+18.38%
Median Estimated Home Value
Housing Facts and Stats
| Yamhill County | Oregon | USA | |
|---|---|---|---|
| Median Estimated Home Value | $440K | $465K | $293K |
| Est. Home Value 12-Mo. Change | +18.4% | +23.5% | +15.3% |
Price Range of Homes Sold
Last Rolling 6 Months – May 2021- October 2021

Price per Square Foot of Homes Sold
Last Rolling 6 Months – May 2021- October 2021

Size of Homes Sold
Last Rolling 6 Months – May 2021- October 2021

Archived: September 2021
Yamhill County, Oregon
Median Estimated Home Value:$437,970 —– Updated: 09/30/2021 —– Change over last month: 2.08% —– Change over last 12 months:+18.56%
Median Estimated Home Value
Housing Facts and Stats
| Yamhill County | Oregon | USA | |
|---|---|---|---|
| Median Estimated Home Value | $438K | $466K | $292K |
| Est. Home Value 12-Mo. Change | +18.6% | +24.1% | +15.4% |
Price Range of Homes Sold
Last Rolling 6 Months – April 2021- September 2021

Price per Square Foot of Homes Sold
Last Rolling 6 Months – April 2021- September 2021

Size of Homes Sold
Last Rolling 6 Months – April 2021- September 2021

Archived: August 2021
Yamhill County, Oregon
Median Estimated Home Value:$429,050 —– Updated: 08/31/2021 —– Change over last month: 2.47% —– Change over last 12 months:+17.45%
Median Estimated Home Value
Housing Facts and Stats
| Yamhill County | Oregon | USA | |
|---|---|---|---|
| Median Estimated Home Value | $429K | $456K | $281K |
| Est. Home Value 12-Mo. Change | +17.5% | +16.6% | +10.9% |
Price Range of Homes Sold
Last Rolling 6 Months – March 2021- August 2021

Price per Square Foot of Homes Sold
Last Rolling 6 Months – March 2021- August 2021

Size of Homes Sold
Last Rolling 6 Months – March 2021- August 2021

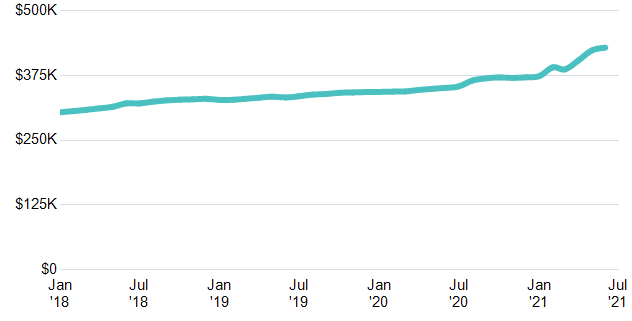
Archived: July 2021
Yamhill County, Oregon
Median Estimated Home Value:$418,690 —– Updated: 07/31/2021 —– Change over last month: -2.31% —– Change over last 12 months:+18.33%
Median Estimated Home Value
Housing Facts and Stats
| Yamhill County | Oregon | USA | |
|---|---|---|---|
| Median Estimated Home Value | $419K | $449K | $274K |
| Est. Home Value 12-Mo. Change | +18.3% | +18.4% | +11.2% |
Price Range of Homes Sold
Last Rolling 6 Months – February 2021- July 2021

Price per Square Foot of Homes Sold
Last Rolling 6 Months – February 2021- July 2021

Size of Homes Sold
Last Rolling 6 Months – February 2021- July 2021

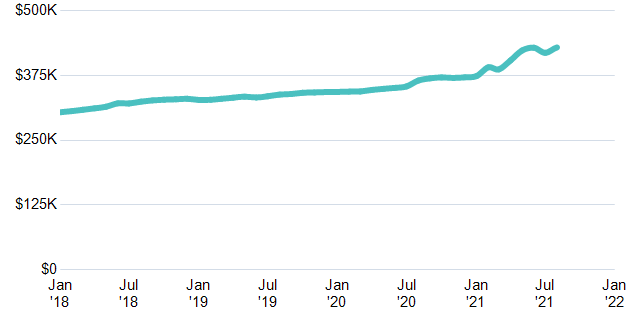
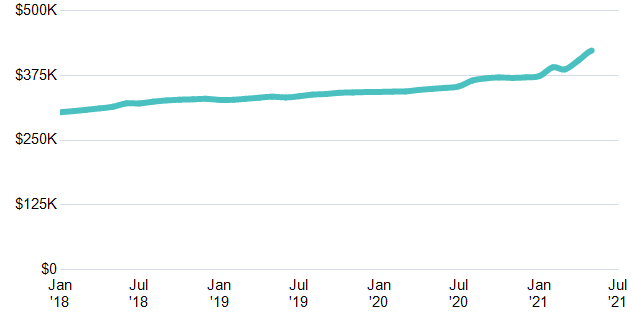
Archived: June 2021
Yamhill County, Oregon
Median Estimated Home Value:$428,610 —– Updated: 06/30/2021 —– Change over last month: 1.28% —– Change over last 12 months:+22.08%
Median Estimated Home Value
Housing Facts and Stats
| Yamhill County | Oregon | USA | |
|---|---|---|---|
| Median Estimated Home Value | $429K | $461K | $268K |
| Est. Home Value 12-Mo. Change | +22.1% | +22.4% | +7.8% |
Price Range of Homes Sold
Last Rolling 6 months – January ’21 – June ’21

Price per Square Foot of Homes Sold
Last Rolling 6 months – January ’21 – June ’21

Size of Homes Sold
Last Rolling 6 months – January ’21 – June ’21

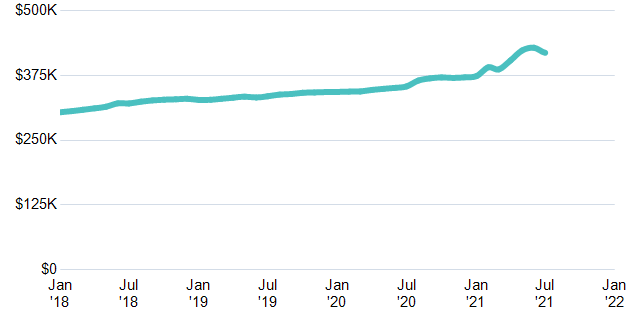
Archived: May 2021
Yamhill County, Oregon
Median Estimated Home Value:$423,190 —– Updated: 05/31/2021 —– Change over last month: 4.68% —– Change over last 12 months:+21.21%
Median Estimated Home Value
Housing Facts and Stats
| Yamhill County | Oregon | USA | |
|---|---|---|---|
| Median Estimated Home Value | $423K | $453K | $262K |
| Est. Home Value 12-Mo. Change | +21.2% | +21.3% | +5.9% |
Price Range of Homes Sold
Last Rolling 6 months – December ’20 – May ’21

Price per Square Foot of Homes Sold
Last Rolling 6 months – December ’20 – May ’21

Size of Homes Sold
Last Rolling 6 months – December ’20 – May ’21

Archived: April 2021
Yamhill County, Oregon
Median Estimated Home Value:$404,280 —– Updated: 04/30/2021 —– Change over last month: 4.52% —– Change over last 12 months:+16.48%
Median Estimated Home Value
Housing Facts and Stats
| Yamhill County | Oregon | USA | |
|---|---|---|---|
| Median Estimated Home Value | $404K | $434K | $256K |
| Est. Home Value 12-Mo. Change | +16.5% | +16.8% | +4.5% |
Price Range of Homes Sold
Last Rolling 6 months – November ’20 – April ’21

Price per Square Foot of Homes Sold
Last Rolling 6 months – November ’20 – April ’21

Size of Homes Sold
Last Rolling 6 months – November ’20 – April ’21

ARCHIVED: March 2021
Yamhill County, Oregon
Median Estimated Home Value:$386,780 —– Updated: 03/31/2021 —– Change over last month: -1.000% —– Change over last 12 months:+12.44%
Median Estimated Home Value
Housing Facts and Stats
| Yamhill County | Oregon | USA | |
|---|---|---|---|
| Median Estimated Home Value | $387K | $412K | $260K |
| Est. Home Value 12-Mo. Change | +12.4% | +10.4% | +6.3% |
Price Range of Homes Sold
Last Rolling 6 months – October ’20 – March ’21

Price per Square Foot of Homes Sold
Last Rolling 6 months – October ’20 – March ’21

Size of Homes Sold
Last Rolling 6 months – October ’20 – March ’21

ARCHIVED: February 2021
Yamhill County, Oregon
Median Estimated Home Value:$390,700 —– Updated: 02/28/2021 —– Change over last month: +4.54% —– Change over last 12 months:+13.66%
Median Estimated Home Value

Housing Facts and Stats
| Yamhill County | Oregon | USA | |
|---|---|---|---|
| Median Estimated Home Value | $391K | $416K | $259K |
| Est. Home Value 12-Mo. Change | +13.7% | +13.5% | +6.7% |
Price Range of Homes Sold
Last Rolling 6 months – September ’20 – February ’21

Price per Square Foot of Homes Sold
Last Rolling 6 months – September ’20 – February ’21

Size of Homes Sold
Last Rolling 6 months – September ’20 – February ’21

ARCHIVED: January 2021
Yamhill County, Oregon
Median Estimated Home Value:$373,730 —– Updated: 01/31/2021 —– Change over last month: +0.62% —– Change over last 12 months:+8.91%
Median Estimated Home Value
Housing Facts and Stats
| Yamhill County | Oregon | USA | |
| Median Estimated Home Value | $374K | $397K | $254K |
| Estimated Home Value 12-Month Change | +8.9% | +8.2% | +4.2% |
Price Range of Homes Sold
Last Rolling 6 months – August ’20 – January ’21

Price per Square Foot of Homes Sold
Last Rolling 6 months – August ’20 – January ’21

Size of Homes Sold
Last Rolling 6 months – August ’20 – January ’21

ARCHIVED: December 2020
Yamhill County, Oregon
Median Estimated Home Value:$370,210 —– Updated: 12/31/2020 —– Change over last month: 0% —– Change over last 12 months:+7.98%
Median Estimated Home Value
Housing Facts and Stats
| Yamhill County | Oregon | USA | |
| Median Estimated Home Value | $370K | $389K | $256K |
| Estimated Home Value 12-Month Change | +8% | +6.1% | +5.1% |
Price Range of Homes Sold
Last Rolling 6 months – July ’20 – December ’20

Price per Square Foot of Homes Sold
Last Rolling 6 months – July ’20 – December ’20

Size of Homes Sold
Last Rolling 6 months – July ’20 – December ’20

ARCHIVED: November 2020
Yamhill County, Oregon
Median Estimated Home Value:$370,210 —– Updated: 11/30/2020 —– Change over last month: -.30% —– Change over last 12 months:+8.18%
Median Estimated Home Value

Housing Facts and Stats
| Yamhill County | Oregon | ||
| Median Estimated Home Value | $370K | $389K | $256K |
| Estimated Home Value 12-Month Change | +8.2% | +6.2% | +4.9% |
Price Range of Homes Sold
Last Rolling 6 months – June ’20 – November ’20

Price per Square Foot of Homes Sold
Last Rolling 6 months – June ’20 – November ’20

Size of Homes Sold
Last Rolling 6 months – June ’20 – November ’20

ARCHIVED: October 2020
Yamhill County, Oregon
Median Estimated Home Value:$371,310 —– Updated: 10/31/2020 —– Change over last month:+.51% —– Change over last 12 months:+8.72%
Median Estimated Home Value
Housing Facts and Stats
| Yamhill County | Oregon | USA | |
| Median Estimated Home Value | $371K | $376K | $254K |
| Estimated Home Value 12-Month Change | +8.7% | +2.7% | +4.7% |
Price Range of Homes Sold
Last Rolling 6 months – May ’20 – October ’20

Price per Square Foot of Homes Sold
Last Rolling 6 months – May ’20 – October ’20

Size of Homes Sold
Last Rolling 6 months – May ’20 – October ’20

ARCHIVED: September 2020
Yamhill County, Oregon
Median Estimated Home Value:$369,410 —– Updated: 9/30/2020 —– Change over last month:+1.13% —– Change over last 12 months:+8.91%
Median Estimated Home Value
Price Range of Homes Sold
Last Rolling 6 months – April ’20 – September ’20

Price per Square Foot of Homes Sold
Last Rolling 6 months – April ’20 – September ’20

Size of Homes Sold
Last Rolling 6 months – April ’20 – September ’20

ARCHIVED: August 2020
Yamhill County, Oregon
Median Estimated Home Value:$365,290 —– Updated: 8/31/2020 —– Change over last month:+3.24% —– Change over last 12 months:+8.06%
Median Estimated Home Value

Housing Facts and Stats
| Yamhill County | Oregon | USA | |
| Median Estimated Home Value | $365K | $391K | $253K |
| Estimated Home Value 12-Month Change | +8.1% | +7.1% | +3.5% |
Price Range of Homes Sold
Last Rolling 6 months – March ’20 – August ’20

Price per Square Foot of Homes Sold
Last Rolling 6 months – March ’20 – August ’20

Size of Homes Sold
Last Rolling 6 months – March ’20 – August ’20

ARCHIVED: July 2020
Yamhill County, Oregon
Median Estimated Home Value:$353,830 —– Updated: 7/31/2020 —– Change over last month:+.78% —– Change over last 12 months:+5.7%
Median Estimated Home Value
Housing Facts and Stats
| Yamhill County | Oregon | USA | |
| Median Estimated Home Value | $354K | $379K | $247K |
| Estimated Home Value 12-Month Change | +5.7% | +4.4% | +1.5% |
Price Range of Homes Sold
Last Rolling 6 months – Feb’20 – July’20

Price per Square Foot of Homes Sold
Last Rolling 6 months – Feb’20 – July’20

Size of Homes Sold
Last Rolling 6 months – Feb’20 – July’20

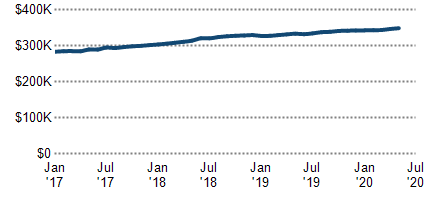
ARCHIVED: June 2020
Yamhill County, Oregon
Median Estimated Home Value:$351,100 —– Updated: 6/30/2020 —– Change over last month:+.56% —– Change over last 12 months:+5.61%
Median Estimated Home Value
Yamhill County Oregon USA
Housing Facts and Stats
| Yamhill County | Oregon | USA | |
| Median Estimated Home Value | $351K | $376K | $249K |
| Estimated Home Value 12-Month Change | +5.6% | +4.4% | +2% |
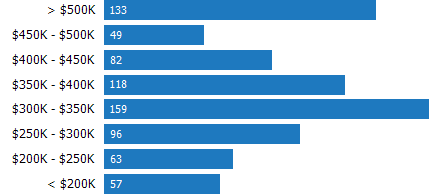
Price Range of Homes Sold
Last Rolling 6 months – Jan’20 – June’20

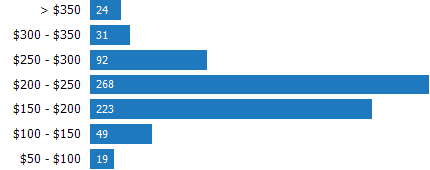
Price per Square Foot of Homes Sold
Last Rolling 6 months – Jan’20 – June’20

Size of Homes Sold
Last Rolling 6 months – Jan’20 – June’20

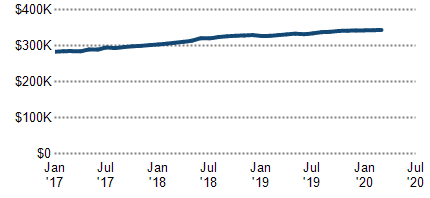
ARCHIVED : May 2020
Yamhill County, Oregon
Median Estimated Home Value:$349,140 —– Updated: 5/31/2020 —– Change over last month:+.59% —– Change over last 12 months:+4.5%
Median Estimated Home Value
Housing Facts and Stats
| Yamhill County | Oregon | USA | |
| Median Estimated Home Value | $349K | $373K | $248K |
| Estimated Home Value 12-Month Change | +4.5% | +3.2% | +2% |
Price Range of Homes Sold
Last Rolling 6 months – Dec’19 – May’20

Price per Square Foot of Homes Sold
Last Rolling 6 months – Dec’19 – May’20

Size of Homes Sold
Last Rolling 6 months – Dec’19 – May’20
ARCHIVED: April 2020
Yamhill County, Oregon
Median Estimated Home Value:$347,090 —– Updated: 4/30/2020 —– Change over last month:+.86% —– Change over last 12 months:+4.53%
Median Estimated Home Value

Housing Facts and Stats
| Yamhill County | Oregon | USA | |
| Median Estimated Home Value | $347K | $371K | $245K |
| Estimated Home Value 12-Month Change | +4.5% | +3.9% | +1.5% |
Price Range of Homes Sold
Last Rolling 6 months – Nov’19 – April’20

Price per Square Foot of Homes Sold
Last Rolling 6 months – Nov’19 – April’20

Size of Homes Sold
Last Rolling 6 months – Nov’19 – April’20

ARCHIVED: March 2020
Yamhill County, Oregon
Median Estimated Home Value:$344,120 —– Updated: 3/31/2020 —– Change over last month:+0.11% —– Change over last 12 months:+4.3%
Median Estimated Home Value
Housing Facts and Stats
| Yamhill County | Oregon | USA | |
| Median Estimated Home Value | $344K | $373K | $244K |
| Estimated Home Value 12-Month Change | +4.3% | +4.6% | +0.8% |
Price Range of Homes Sold
Last Rolling 6 months – Oct’19 – March’20

Price per Square Foot of Homes Sold
Last Rolling 6 months – Oct’19 – March’20
Size of Homes Sold
Last Rolling 6 months – Oct’19 – March’20

ARCHIVED : February 2020
Yamhill County, Oregon
Median Estimated Home Value:$343,740 —– Updated: 2/29/2020 —– Change over last month:+0.17% —– Change over last 12 months:+4.8%
Median Estimated Home Value

Housing Facts and Stats
| Yamhill County | Oregon | USA | |
| Median Estimated Home Value | $344K | $367K | $243K |
| Estimated Home Value 12-Month Change | +4.8% | +3% | +0.1% |
Price Range of Homes Sold
Last Rolling 6 months – Sept’19 – Feb’20
Price per Square Foot of Homes Sold
Last Rolling 6 months – Sept’19 – Feb’20
Size of Homes Sold
Last Rolling 6 months – Sept’19 – Feb’20