The Easy Truth: What You Really Need To Know About Home Prices
According to recent data from Fannie Mae, almost 1 in 4 people still think home prices are going to come down. If you’re one of the people worried about that or maybe you are hoping for that, here’s what you need to know.
Much of your fear or anxiety likely stems from what you hear in the media or read online. But here’s the key point: Negative headlines grab attention. This means you might not be getting the complete story. You could be getting just the clickbait version. As Jay Thompson, a Real Estate Industry Consultant, explains:
“Housing market headlines are everywhere. Many are quite sensational, ending with exclamation points or predicting impending doom for the industry. Clickbait, the sensationalizing of headlines and content, has been an issue since the dawn of the internet, and housing news is not immune to it.”
Here’s a look at the data to set the record straight.
Home Prices Rose the Majority of the Past Year, Nationwide
Case-Shiller releases a report each month on the percent of monthly home price changes. If you look at their data from January 2023 through the latest numbers available, here’s what you’d see (Nationwide):
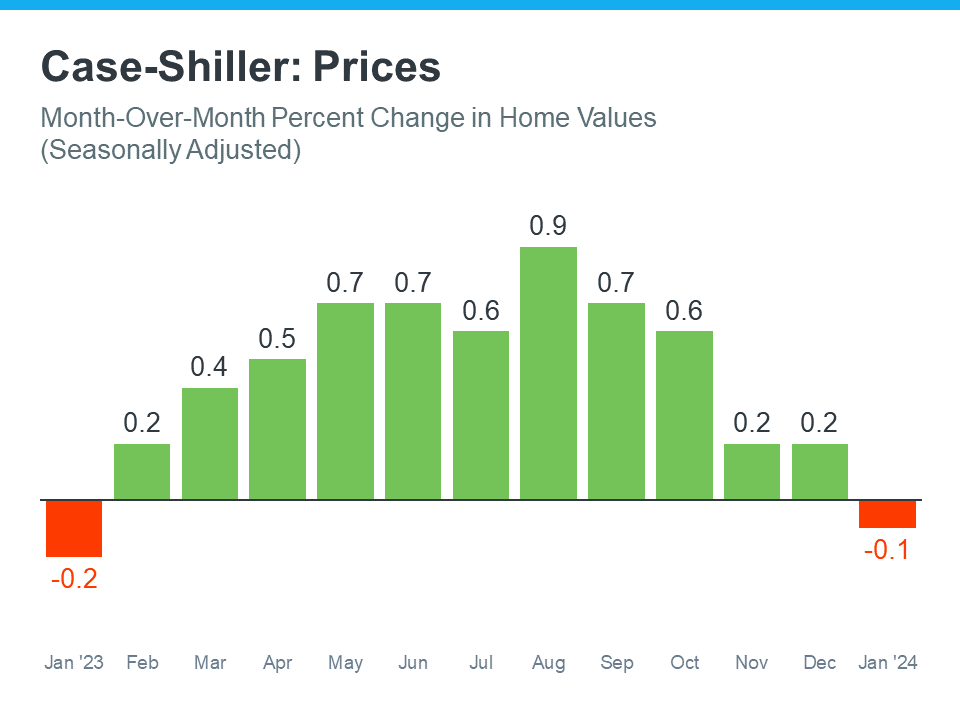
Depending on what color you’re more drawn to, if you look at the green, you’ll see home prices rose for the majority of the past year. But, if you’re drawn to the red, you may only focus on the two slight declines. This red color is what a lot of media coverage focuses in on. Since negative news sells, drawing attention to these slight dips happens often. But that loses sight of the bigger picture.
Here’s what this data really says. There’s a lot more green in that graph than red. And even for the two red bars, they’re so slight, they’re practically flat. If you look at the year as a whole, home prices still rose overall.
It’s perfectly normal in the housing market for home price growth to slow down in the winter. That’s because fewer people move during the holidays and at the start of the year, so there’s not as much upward pressure on home prices during that time. That’s why, even the green bars toward the end of the year show smaller price gains.
Home Prices Locally – Yamhill County
Now let’s look at the numbers from Yamhill County over the last 13 months.
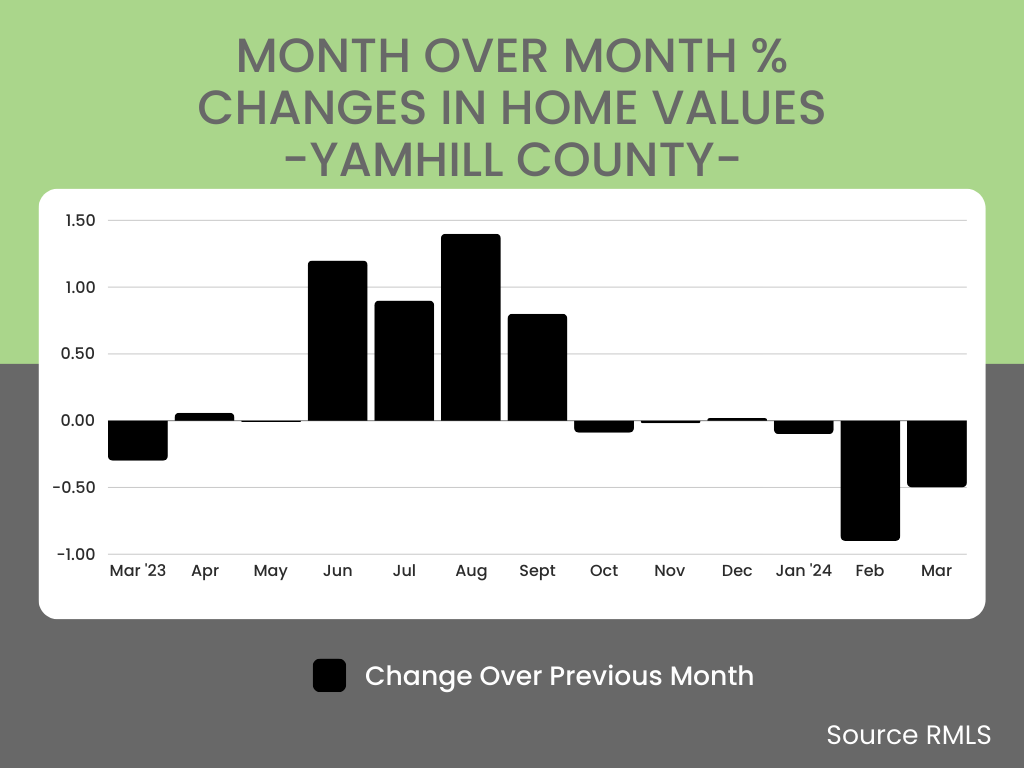
Similar to what you saw Nationwide, the winter months dropped a bit, and the summer months were a bit higher. The typical seasonality with homes. Looking at this above graph quickly, one could think that home prices were dramatically dropping and gaining depending on the month you looked at. At a closer look, you see the changes over the 13 months are only a total of a 2.3% spread. When talking about homes with prices in the mid $400k’s, and the monthly changes being less than 1% either way for 11 of the 13 months, we are actually talking small amounts.
To further this point, below is a graph of the same 13 months, with the respective monthly median home prices reflecting the same above % changes….
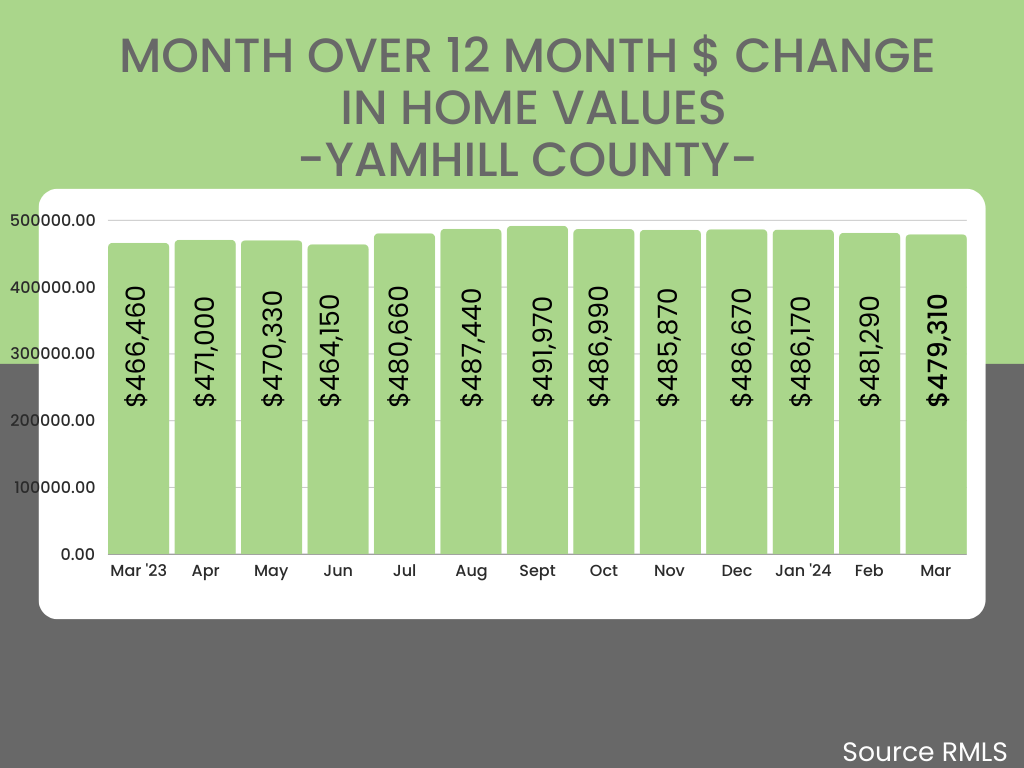
As you can see, here in Yamhill County, home prices for the most part have remained steady with a slight value increase over the past year.
The overarching story is that prices went up last year, not down.
To sum everything up, as Case Shiller explains, (the source for the national data in the red/green graph above):
“Month-over-month numbers were relatively flat, . . . However, the annual growth was more significant for both indices, rising 7.4 percent and 6.6 percent, respectively.”
And in focusing back to Yamhill county, again similar to the nation in that month over month numbers were relatively flat, we however, had annual growth of a bit less than the nation, at 2.3%. Still though, growth, not decline like the media seems to want everyone to believe. Here in Oregon, our home price growth may be a bit slower, partially because our home prices are one of the higher price points of the nation. Compare this to other areas of the nation where home prices are in the just at or under the $400k mark and there is plenty of land to build, we do not have as many people moving and buying homes here… keeping competition a bit lower.
This all said, home prices going up every year is common. Here you can see Yamhill County growth over the last 5 years.
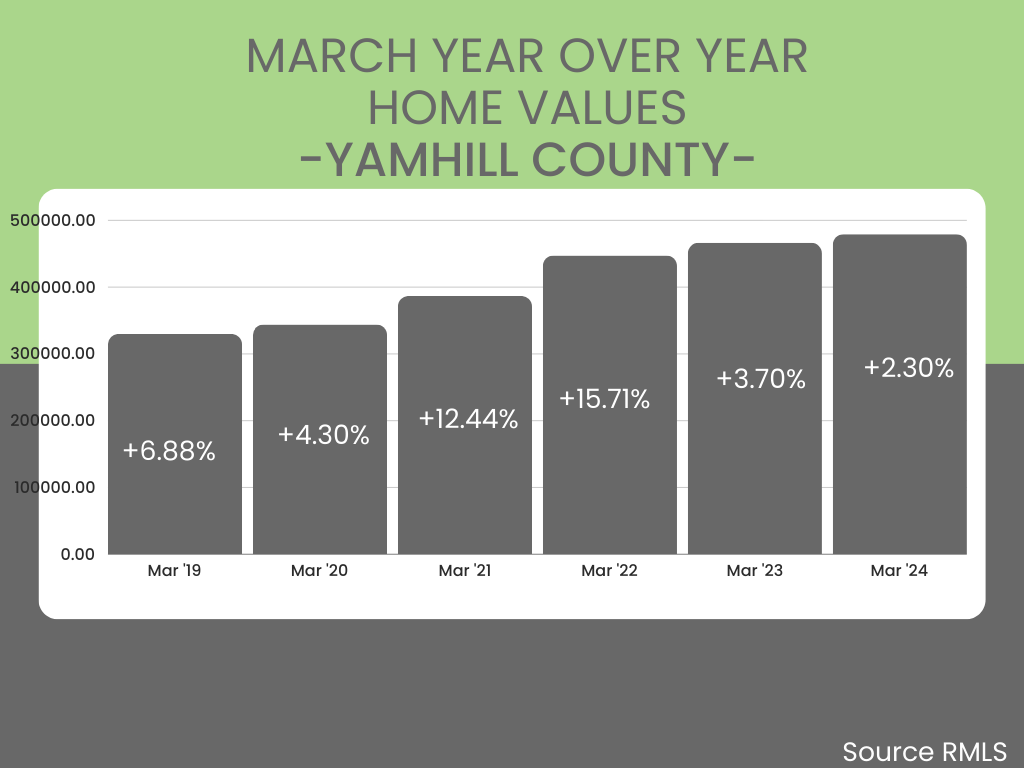
Besides what we call the “Unicorn Years” of Covid where home prices soared greater than usual, you can see a steady growth of prices every year. In fact averaging out 2019, 2020, 2023 and 2024 here in Yamhill County, average home price growth is 4.295%.
As you can see, the sensationalization of the media is exactly just that. They have cherry picked a few minor moments in time and without showing the whole picture, have sold their headlines. If you are curious to watch the current market here in Yamhill County, every month I update my website by the 10th of the month with the previous months numbers. You can click HERE to see this page or look up leannecray.com, click on the “Yamhill County Monthly Markets Update” tab anytime and scroll through the history. (I have history on my site back to early 2020)
The Bottom Line
As you can see, the data shows that, as a whole, home prices rose over the past year. If you have questions about what’s happening with home prices in our area, I’d love to sit down and chat.